So we are back with the same issue: statement cache/procedure cache behavior under the stress of executing a high volume of prepared statements.
I have just finished another round of tests around this issue (which has caused quite a lot of troubles in the past releases of ASE) and I want to share and recapitulate (the more you explain the more you understand yourself).
First, let's quote a bit of documentation - to lay out who are the players in our field. I will reserve it to a very few aspect of what is relevant. .
[1] Procedure Cache: {Performance and Tuning Series: Basics. Chapter 5: Memory Use and Performance}
Adaptive Server maintains an MRU/LRU (most recently used/least recently used) chain of stored procedure query plans. As users execute stored procedures, Adaptive Server looks in the procedure cache for a query plan to use. If a query plan is available, it is placed on the MRU end of the chain, and execution begins.
...
The memory allocated for the procedure cache holds the optimized query plans (and occasionally trees) for all batches, including any triggers.
[2] Statement Cache: {Performance and Tuning Series: Basics. Chapter 5: Memory Use and Performance}
The statement cache saves SQL text and plans previously generated for ad hoc SQL statements, enabling Adaptive Server to avoid recompiling incoming SQL that matches a previously cached statement. When enabled, the statement cache reserves a portion of the procedure cache
[3] Streamlined Dynamic SQL: {Performance and Tuning Series: Basics. Chapter 5: Memory Use and Performance}
In versions earlier than 15.7, Adaptive Server stored dynamic SQL statements (prepared statements) and their corresponding LWP in the dynamic SQL cache. Each LWP for a dynamic SQL statement was identified based on the connection metadata. Because connections had different LWPs associated with the same SQL statement, they could not reuse or share the same LWP. In addition, all LWPS and query plans created by the connection were lost when the Dynamic SQL cache was released.
In versions 15.7 and later, Adaptive Server uses the statement cache to also store dynamic SQL statements converted to LWPs. Because the statement cache is shared among all connections, dynamic SQL statements can be reused across connections.
[4] DYNAMIC_PREPARE property:
When client connection executing prepared statement sends request to ASE, it may either send language command as plain SQL text (if DYNP is set to false), or request an ASE to create LWP for it (if DYNP is set to true - something that may be seen in monSysSQLText as "create proc dynXXX as..." & DYNAMIC_SQL dynXXX...).
To quote from Managing Workloads with ASE, "The statement cache reproduces the same benefits as fully prepared statements as it takes language commands from client applications, replaces literals with parameters, creates a statement hash key, compiles and optimizes the statement, and creates a Light Weight Proc for re‐use."
In plain language, we may describe the playground of our tests in the following way:
When a client connection sends an ASE a request, if this request contains a prepared statement, the client connection will either send it as it is (SQLLANG) or convert it into a create procedure request (DYNP/LWP). If the statement cache is enabled on ASE, ASE will store the SQL text & pointer to its LWP in the statement cache, install the plan/tree of the corresponding LWP in the procedure cache and ultimately execute it.
The motivation behind all this is to reuse as much resources within ASE as possible. Without the statement cache, each adhoc query has to be "converted" [parsed/normalized/compiled] into query plan individually and dropped after being executed, thus preventing reuse. With statement cache enabled, the query is looked up in the statement cache instead and if the match is found its plan is cloned from the procedure cache and executed. If it is not there, it will be "converted" and installed for reuse.
The same applies to prepared statement. Without the statement cache [and when streamlined option is turned off], each prepared statement has to be converted [parsed/normalized/compiled] into query plan and stored in the procedure cache individually - to be released at client disconnect. With statement cache and streamlined option enabled, the statement is looked up, cloned and executed (or stored for later reuse).
In fact, this "reuse" methodology is a patented feature [2012]. It involves scanning statement/procedure cache memory page chains (holding spinlock) and either installing a new or reusing an old object.
![StCacheSearch]()
In fact, one may collect quite a lot of information on all this over the web.
So far the theory. We know who is the player on our testing grounds. What we will see below based on the tests done is how ASE reacts to changing different configuration parameters related to the relatively new aggressive resource reuse aim.
I have confined myself in the tests to only four possible setting to play with: existence of the statement cache (STxM), streamlined SQL option (STRx), DYNAMIC_PREPARE option (DYNPx) and configuring connection setting to use statement_cache (STx). This results in the following matrix of possible tests:
![pst_TestTimes]()
I run 10 Java clients executing unique prepared statements on a 15-thread ASE, 15.7 ESD#4, SPARC. The "literal autoparam" setting is turned on, so is the "plan sharing" option.
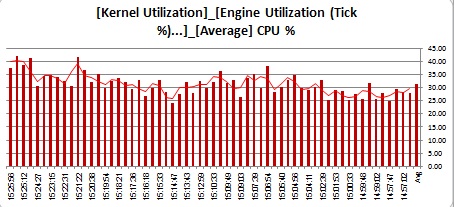
The first graph represents the thread busy for all our tests:
![pst_ThreadBusy]()
First thing to notice is that whenever the prepared statement meets an ASE, if the connection property of DYNAMIC_PREPARE is turned off, ASE responds in 5 to 10 % leap in thread utilization. On the one hand, it seems pretty obvious: we "reuse" LWPs rather than demand ASE to generate (parse/normalize/compile) plan for each statement over and over again. This is no so obvious, though, since in our case we generate LWPs wrapping 10 completely unique streams of prepared statements. Reuse here is pretty minimal. It seems a bit odd that making an ASE to scan its statement cache, install new LWP + QP and execute it to have less CPU impact than just prepare the plan and drop it. The numbers, though, are unequivocal. Even if ASE faces a thick stream of unique prepared statements requests, it handles it much better if the client requests them as procedures (incidentally, it was NOT the case with previous ASE 15 releases).
I'd like to share also the following graph:
![pst_OpenObjects]()
We know from documentation that each cached statement consumes one object descriptor. So it makes sense that turning the statement cache on the number of active object descriptors will rise [12:25]. The impact, though, is much greater when the streamlined option is turned on. Something to be kept in mind.
This one is also interesting:
![pst_LockRequests]()
![pst_ShraedRow]()
Each time the DYNP is turned on, the number of lock requests is doubled.
This one is also telling:
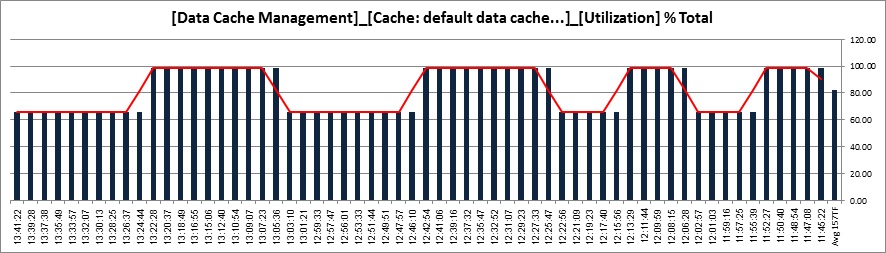
![pst_TDB_Util]()
![pst_DDC_Util]()
Since we create our LWPs in tempdb, and since we run exclusively the code that causes ASE to generate LWPs, each time the DYNP is turned on, tempdb utilization surges up.
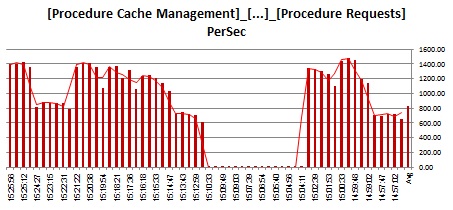
Now, let's see how we are handling procedure requests and statements requests in each case:
Procedures:
![pst_ProcReq]()
![pst_ProcRem]()
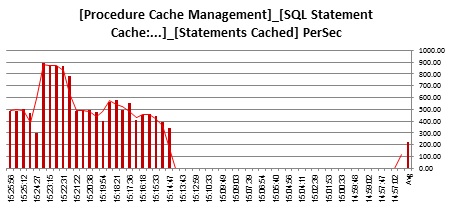
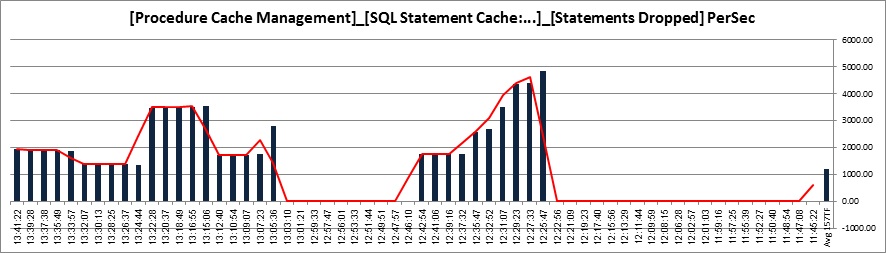
Statements:
![pst_StCached]()
![pst_StDropped]()
![pst_StINCache]()
![pst_StNotCached]()
![pst_StNotINCache]()
We run 12K procedure requests per second. Demand on the statement cache is highest when we run DYNPs streaming them into the statement cache (streamlined on).
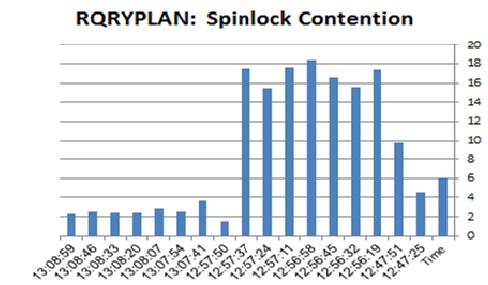
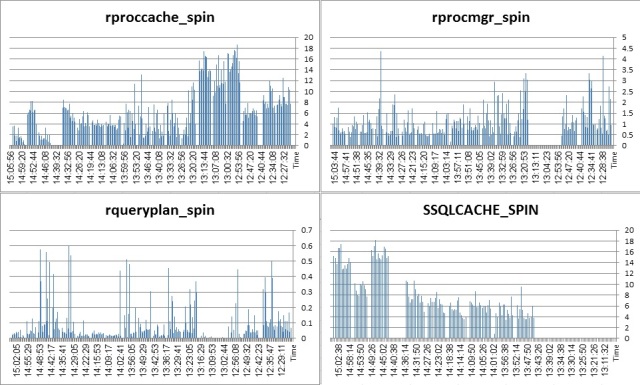
Happily enough, this high volume of prepared statements washing the statement/procedure cache is handled with a relatively low spinlock contention (I will test it running client connections > threads situation in future).
![pst_SpinPCH]()
![pst_SpinPMGR]()
![pst_SpinQRYP]()
![pst_SpinSSQL]()
It is important to state here that ASE runs with TF758 turned on. Without it you would have seen proc_cache spinlock getting to 10-s.
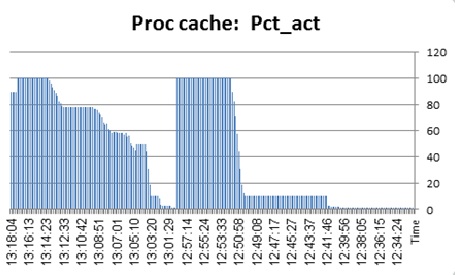
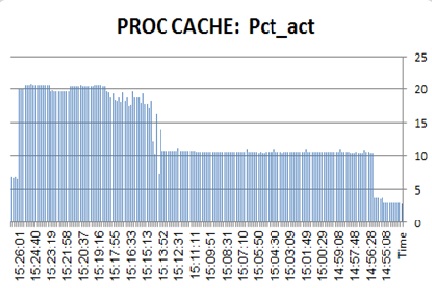
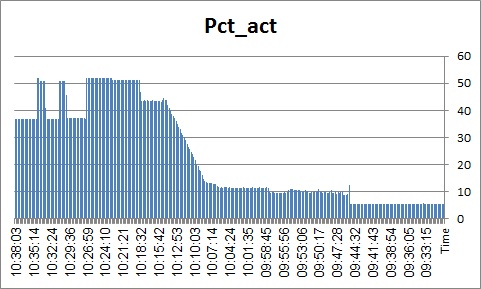
Let's see the statement cache utilization from another angle (monStatementCache):
![pst_STCACHE]()
Our cache hit ratio is not impressive (little wonder in our situation of running unique statements from 10 concurrent sessions). What is interesting to notice, though, is the number of statement the same 20MB cache contains running with and without the streamlined option. Turning the streamlined option on caused the number of statements contained in the statement cache to double.
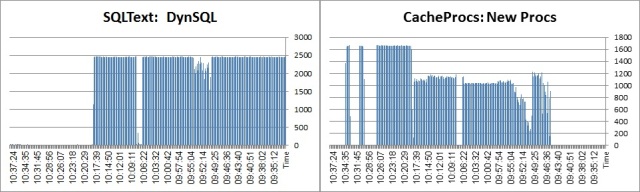
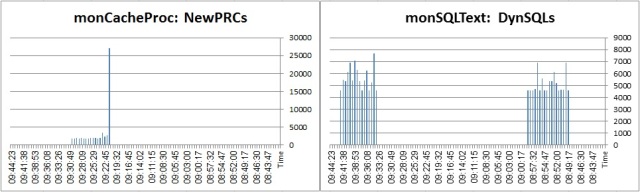
The following displays what the client connection requests from ASE in terms of LWP requests:
![pst_DYNSQLS]()
When we turn the DYNP on we start requesting to create procedure from ASE explicitly. However, the lifetime of the procedures in the cache is reverse: when DYNP is off, ASE creates procedures implicitly and stores them in the statement cache + procedure cache. When DYNP is on, ASE creates the procedure and drops it almost instantly - unless the streamlined option is turned on, causing ASE to store them in the statement cache as well - in a far greater number (incidentally, the names of the DYNP LWPs and ADHOC LWPs also differ).
So, what have we learned from all this, if at all?
From the ASE load perspective, we have seen that configuring the ASE to reuse (streamline) the dynamic SQLs is beneficial even if we face a situation of concurrent client connections generating a high volume of unique prepared statements. Turning the DYNAMIC_PREPARE option off would only cause an additional 10% surge in CPU utilization (there is a problem that we do not really know how the throughput is influenced but rather assume it from the rate of procedure request, which is not precisely true - I will have to change the way I perform the load in future in order to generate more accurate comparison here).
We have learned that forcing ASE to reuse (streamline) the dynamic SQLs will force the procedure cache to handle much more plans/trees since in addition to adhoc queries landing in the statement/procedure cache to aged out, LWPs and their plans that would have died as clients disconnect will continue to occupy both statement and procedure cache, until they age out. Although we have seen that setting the streamlined option on is beneficial to an ASE in our situation, we must not neglect this fact (after all we run each test at a time, not mix - had we mixed, both adhocs and dynps would land in the same area). In addition, since statement cache is a general resource, if we know that we have bad (unique & high volume) DYNPs workload threatening to wash out our statement cache, perhaps the best decision would be to turn the streamlined option off and keep these DYNPs off statement cache altogether.
We have learned that open objects usage surges up with the streamlined option turned on, so it must be addressed in configuration in order to avoid descriptor reuse.
We have learned that we have to treat tempdb differently if we know that we will be streamlining. It's utilization goes way up when ASE has to create LWPs at high rate, so additional attention is needed here.
What we have not understood is what is the origin of the consistent leap in shared row requests when we configure DYNAMIC_PREPARE to true. Is it because we handle explicit create procedure requests? To be tested further.
What we have also learned is how the configurations affecting statement cache may influence the procedure cache. Documentation states that "statement cache memory is taken from the procedure cache memory pool" - a puzzling statement since the memory consumption of both is added together (logical/physical ASE memory) System Administration Guide: Volume 2, Configuring Memory. What is obvious, though, is that the two have very high degree of reciprocity: each statement landing into statement cache will have to consume space in the procedure cache for the LWP tree/plan. Which means that statement cache is not a portion of procedure cache. If configured, it will consume a portion of procedure cache which is directly influenced by its size (it is said to be reserved ahead in the documentation). This is much more accurate way to explain the relationship between statement cache and procedure cache.
We still know very little about the procedure cache. We know that it has its chain (one, or more if it has already been implemented) of procedure query plans/trees. We do not know, for example, which of the procedure cache modules / allocators each occupy and if these have been partitioned. I did monitor the impact of the tests I run on both, but the data it generated has been pretty confusing/uninformative. Especially so since there is no documentation whatsoever explaining procedure cache structure in details. We also know very little about ELC and its impact on our tests - although it is pretty sure that it plays a role here (TF758 may testify this).
Which returns us to a famous Socratic sage: the more you know the more you know you don't know...
Hm, should we start the testing over?
ATM.


 Note: DBCC PSS is not a formally documented command; it's output may change between versions without warning. This example output is from Adaptive Server Enterprise/15.7.0/EBF 20369 SMP ESD#02 /P/Sun_svr4/OS 5.10/ase157esd2/3109/64-bit/FBO/Sat Jul 7 10:07:17 2012