I have just finished the first round of tests of ESD#4 on Solaris SPARC platform. I have to confirm: the ESD#4 seems to has been finally vaccinated against wasteful reuse of the statement/procedure cache by “inappropriate” use in client-side code. It looks like the painful experience of seeing ASE suffocating unexpectedly under the stress generated by the code that has been running “more or less smoothly” on an old ASE 12.5.4 is behind us. I will cross test these issues again tomorrow (as well as shift my tests a bit to check yet another issue around the misuse of the statement cache). But so far I must say that I found that ASE handles this situation successfully at last. Very good news!
Here are the bare facts, again.
The tests I have run on the SPARC host on ASE 12.5.4 version (ESD#10):
| S125_6LWP_DYN1_ST0_ST0M_1 | 08:50:00 |
| S125_6LWP_DYN0_ST0_ST0M_1 | 09:01:00 |
| S125_6LWP_DYN0_ST0_ST20M_1 | 09:12:00 |
| S125_6LWP_DYN0_ST1_ST20M_1 | 09:22:00 |
| S125_6LWP_DYN1_ST1_ST20M_1 | 09:34:00 |
The tests I have run on the SPARC host on ASE 15.7 – threaded mode kernel (ESD#4):
| S157T_6LWP_DYN1_ST0_STR0_PLA0_ST0M_1 | 08:50:00 |
| S157T_6LWP_DYN1_ST0_STR1_PLA0_ST0M_1 | 09:01:00 |
| S157T_6LWP_DYN1_ST0_STR1_PLA1_ST0M_1 | 09:12:00 |
| S157T_6LWP_DYN0_ST0_STR0_PLA0_ST0M_1 | 09:22:00 |
| S157T_6LWP_DYN0_ST0_STR1_PLA0_ST0M_1 | 09:34:00 |
| S157T_6LWP_DYN0_ST0_STR1_PLA1_ST0M_1 | 09:46:00 |
| S157T_6LWP_DYN1_ST0_STR0_PLA0_ST20M_1 | 09:56:00 |
| S157T_6LWP_DYN1_ST0_STR1_PLA0_ST20M_1 | 10:06:00 |
| S157T_6LWP_DYN1_ST1_STR0_PLA0_ST20M_1 | 10:15:00 |
| S157T_6LWP_DYN1_ST1_STR1_PLA0_ST20M_1 | 10:24:00 |
| S157T_6LWP_DYN1_ST1_STR1_PLA1_ST20M_1 | 10:34:00 |
| S157T_6LWP_DYN0_ST1_STR0_PLA0_ST20M_1 | 10:43:00 |
| S157T_6LWP_DYN0_ST1_STR1_PLA0_ST20M_1 | 10:52:00 |
| S157T_6LWP_DYN0_ST1_STR1_PLA1_ST20M_1 | 11:01:00 |
| S157T_6LWP_DYN0_ST1_STR1_PLA1_ST200M_1 | 11:09:00 |
| S157T_6LWP_DYN1_ST1_STR1_PLA1_ST200M_1 | 11:17:00 |
The tests I have run on the SPARC host on ASE 15.7 – process mode kernel (ESD#4):
| S157P_6LWP_DYN1_ST0_STR0_PLA0_ST0M_1 | 12:24:00 |
| S157P_6LWP_DYN1_ST0_STR1_PLA0_ST0M_1 | 12:32:00 |
| S157P_6LWP_DYN1_ST0_STR1_PLA1_ST0M_1 | 12:43:00 |
| S157P_6LWP_DYN0_ST0_STR0_PLA0_ST0M_1 | 12:52:00 |
| S157P_6LWP_DYN0_ST0_STR1_PLA0_ST0M_1 | 13:01:00 |
| S157P_6LWP_DYN0_ST0_STR1_PLA1_ST0M_1 | 13:09:00 |
| S157P_6LWP_DYN1_ST0_STR0_PLA0_ST20M_1 | 13:18:00 |
| S157P_6LWP_DYN1_ST0_STR1_PLA0_ST20M_1 | 13:27:00 |
| S157P_6LWP_DYN1_ST1_STR0_PLA0_ST20M_1 | 13:37:00 |
| S157P_6LWP_DYN1_ST1_STR1_PLA0_ST20M_1 | 13:45:00 |
| S157P_6LWP_DYN1_ST1_STR1_PLA1_ST20M_1 | 13:53:00 |
| S157P_6LWP_DYN0_ST1_STR0_PLA0_ST20M_1 | 14:02:00 |
| S157P_6LWP_DYN0_ST1_STR1_PLA0_ST20M_1 | 14:11:00 |
| S157P_6LWP_DYN0_ST1_STR1_PLA1_ST20M_1 | 14:20:00 |
| S157P_6LWP_DYN0_ST1_STR0_PLA1_ST200M_1 | 14:28:00 |
| S157P_6LWP_DYN1_ST1_STR0_PLA1_ST200M_1 | 14:37:00 |
| S157P_6LWP_DYN1_ST1_STR1_PLA1_ST200M_1 | 14:44:00 |
| S157P_6LWP_DYN0_ST1_STR1_PLA1_ST200M_1 | 14:50:00 |
The performance graphs:
ASE 12.5.4:

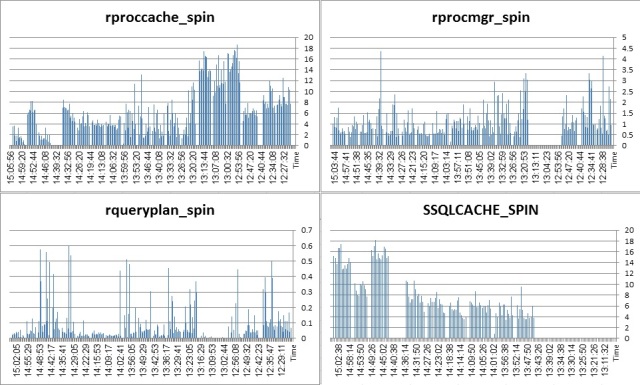
Spinlock Situation (note the way 12.5.4 handles the situation with the statement cache enabled – pure disaster):

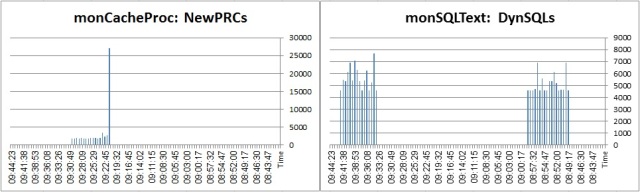
Procedure Cache:

Dynamic SQL/LWPs creation rate:
ASE 15.7 ESD#4 – threaded kernel mode:
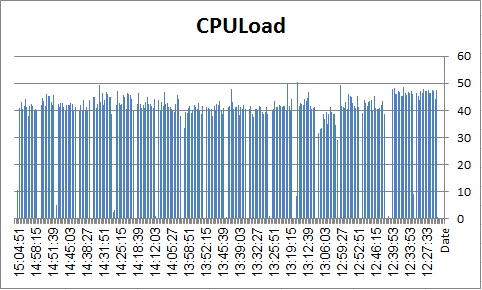
Thread Load:

Spinlock situation:

Procedure cache:

Dynamic SQL/LWPs creation rate:

Statement Cache (not available on 12.5.4):

ASE 15.7 ESD#4 – process kernel mode:
Engine Load:
Spinlock situation:
Procedure cache:

Dynamic SQL/LWPs creation rate:

Statement Cache (not available on 12.5.4):

Threaded kernel mode gives a very steady throughput. More steady than the process kernel mode. There is the same “bug” in the process mode that the sp_monitorconfig at certain point stops reporting on procedure cache utilization (I wonder if the new monMemoryUsage MDA supplements the missing data).
In general, if you do have a client that generates a large number of fully prepared statements, DON’Tturn off the statement cache on the session level and DON’T turn off the DYNAMIC_PREPARE JDBC setting. In both cases, the thread utilization climbs up (and the proccache spinlock). In addition, if the statement cache us ruthlessly turned over due to very high volume of unique statements generated by the code, keep the cache as small as possible – 20M was fine here, 200M was pretty bad.
The threaded kernel mode gives more satisfactory results – more steady performance, slightly better throughput and less bugs.
I will be running more and different tests in the following weeks – as well as comparing performance across a wider spectrum of metrics – but from the point of view of running a high volume of unique prepared statements the problem of ASE 15.x seems to have been solved at last.
ATM.